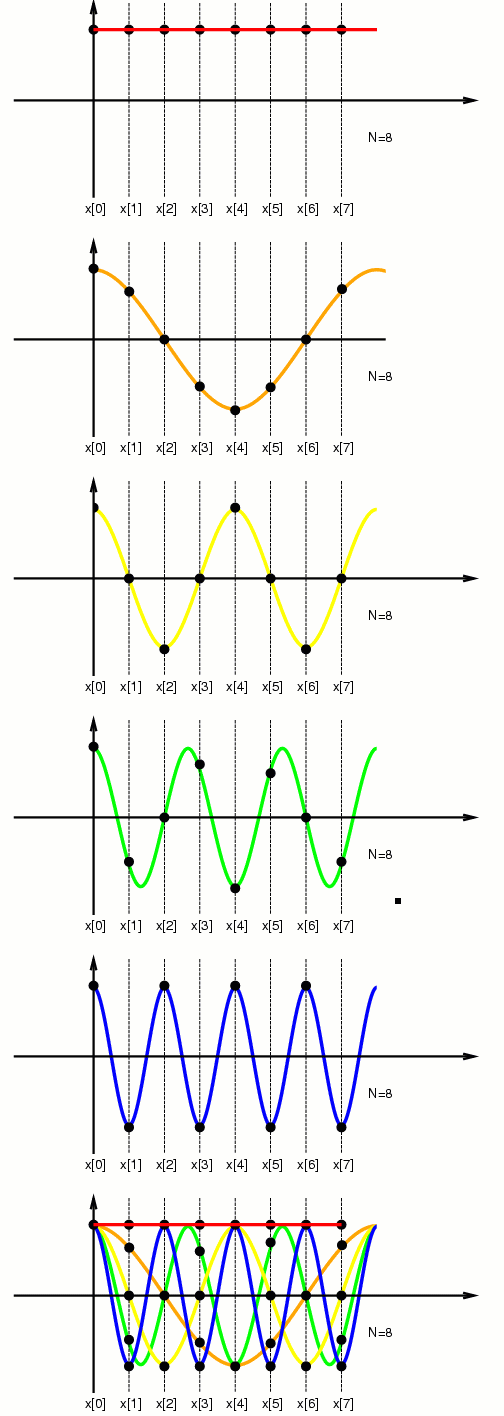
Finally, we see the variously sampled cosines together in the same plot (color coded in order of frequency as red, orange, yellow, green, blue).
The next highest frequency, 1 cycle, is shown in orange. this would be one Hertz if the total duration of the sample was one second (i.e. if the sampling frequency were 8 Hertz). The yellow plot denotes 2 Hertz, green denotes 3 Hertz, and blue denotes 4 Hertz. (The blue 4Hz plot is right at the Nyquist frequency, i.e. exactly half the samping rate.)

Finally, we see the variously sampled cosines together in the same plot
(color coded in order of frequency as red, orange, yellow, green, blue).
If we continue to raise the frequency, we get aliasing, e.g. if we make five cycles of the cosine in 1 second (8 samples), we get a frequency of 5 Hertz (fractional frequency is 5/8), and this produces the same samples as the samples of the 3 Hertz sinewave.