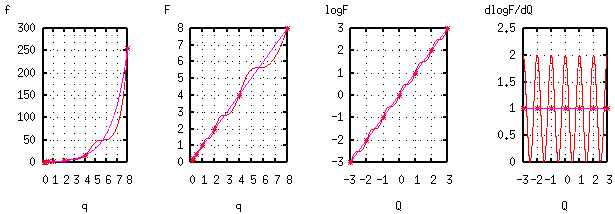
You should be able to write a closed-form mathematical expression for any portion of these various curves, or similar other examples, in terms of any of the plots.

% consider g=f^2, having d.c. sol'n: log(f)=q, F=q, log(F)=Q.
Q=linspace(-3,3,6000);
q=2..^Q;
logF=1/2/pi*sin(2*pi*Q) + Q; % sine plus slope
F=2..^logF;
f=2..^F;
%% not used anywhere: F=log(f)/log(2);
grid
gset nokey
xlabel('q')
ylabel('f')
qintegers=[1/8 1/4 1/2 1 2 4 8];
fintegers=2..^qintegers;
ftrue=2..^q;
subplot(241);
axis(); % set axis to "normal"
plot(q,f,qintegers,fintegers,'+',qintegers,fintegers,"*",q,ftrue)

subplot(242);
xlabel('q')
ylabel('F')
Fintegers=qintegers;
Ftrue=q;
plot(q,F,qintegers,Fintegers,'+',qintegers,Fintegers,"*",q,Ftrue)
Qintegers=log(qintegers)/log(2);
subplot(243);
xlabel('Q')
ylabel('logF')
logFintegers=Qintegers;
logFtrue=Q;
plot(Q,logF,Qintegers,logFintegers,'+',Qintegers,logFintegers,"*",Q,logFtrue)
subplot(244); % Periodizer is dlogF/dQ
xlabel('Q')
ylabel('dlogF/dQ')
%%%axis([-3 3 -4 3])
Qt=Q(1:length(Q)-1); % Qtruncated
dlogFdQ=1000*diff(logF);
dlogFintegers=1*ones(size(Qintegers));
x=[-3 3]; y=[1 1];
plot(Qt,dlogFdQ,Qintegers,dlogFintegers,'+',Qintegers,dlogFintegers,'*',x,y)
subplot(111);